Özgür Polat

Python | Data Analysis

As a Python Developer and Data Analyst, I specialize in crafting robust back-end components, building scalable Python applications, and developing custom Odoo modules tailored to client needs. I actively engage with stakeholders to understand requirements and deliver secure, high-performing solutions.

With more than 3 years of experience in software development and over 5 years in data analysis and academic research, I bring a unique combination of analytical rigor and practical engineering skills. I excel at interpreting complex datasets, conducting statistical tests, and generating actionable insights. Holding a PhD in Economics, I apply a data-driven mindset to solve real-world problems across diverse industries.

I thrive in fast-paced, dynamic environments and embrace lifelong learning with a passion for creative innovation and solving complex challenges. Known for reliability, attention to detail, and a commitment to excellence, I consistently deliver results that exceed expectations. My interpersonal and organizational strengths support effective collaboration and contribute meaningfully to team success and organizational goals.

Work Experience

  • FKS Jan 2023 - Feb 2025
    Python Developer| Odoo

    ● Developed and optimized scalable Python applications/custom Odoo modules, ensuring high performance and alignment with client requirements
    ● Designed and deployed RESTful APIs and OAuth 2.0 for secure third-party integrations, enhancing data interoperability
    ● Optimized SQL queries with PostgreSQL for in-depth data analysis, generating actionable insights
    ● Conducted code reviews, ensuring adherence to PEP 8 standards and best practices​
    ● Leveraged CI/CD tools (GitHub Actions, GitLab CI/CD) for automated testing and deployments
    ● Containerized applications using Docker, streamlining development and production environments
    ● Utilized PyCharm for debugging and optimizing code, ensuring robust and reliable application performance
    ● Delivered full-stack solutions using Python, SQL, JavaScript, HTML/CSS, OWL, and XML for clients across various industries
  • Independent Researcher Sep 2018 - Aug 2021
    Data Analyst | Python | Research

    ● Data analysis with Python, Excel, R and SPSS, and interpreting the results
    ● Data visualization with Tableau and PowerBI
    ● Economic research on the recent developments and writing the output as OpEd articles on BrusselsTimes
    ● Developed programming skills in Python (and its libraries such as Pandas, NumPy, Matplotlib, Seaborn, BeautifulSoup), SQL and Java
  • Selahaddin Eyyubi University Mar 2014 - Jul 2016
    Researcher

    ● Data analysis, tabulating and interpreting the results
    ● Obtained, analyzed and visualized educational, social, economic and demographic data using MS Excel, Stata, R and Tableau
    ● Analyzed and processed complex raw data sets of 2000 users (academics, students) using advanced SQL querying, MS Excel and Tableau visualization
    ● Taught undergraduate and graduate courses in Economics
  • Dicle University Mar 2010 - Mar 2014
    Researcher

    ● Data analysis, tabulating and interpreting the results
    ● Obtained, analyzed and visualized educational, social, economic and demographic data using Excel, SPSS and Stata
    ● Taught undergraduate and graduate courses in Economics
  • Turkish Statistical Institute Nov 2004 - Mar 2010
    Data Analyst| Researcher

    ● Research and analyze of the economic data, implementing forecasting models using Artificial Neural Networks and publishing the results of the analysis
    ● Extracting, processing, and analyzing complex and different datasets using visualization, and analytics tools.
    ● Deriving predictive models using appropriate statistical techniques.
    ● Data preparation prior to analysis: data query and data manipulation in relational databases using Excel.
    ● Collection, cleaning, and implementation of quality control of the data obtained from households and companies through surveys
    ● Organization and checking of regional survey data
    ● Planned data collection and organization of survey study

PROJECTS

Algorithmic Trading

Data of S&P 500 were obtained by creating an API token and value of a portfolio was analyzed to determine each S&P 500 constituent that should be purchased to get an equal-weight version of the index fund, an investing strategy was built that selects the 50 stocks with the highest price momentum and the best value metrics, and recommended trades for an equal-weight portfolio of these 50 stocks were calculated by using Python and its libraries such as Pandas, SciPy and Numpy.

Biodiversity in National Parks

This was a portfolio project phase of Codecademy Data Science Bootcamp. Descriptive statistics and data visualization techniques, as well as Exploratory Data Analysis (EDA), were employed to understand the data better through Pandas, Numpy, Matplotlib and Seaborn. Statistical inference was also be used to test if the observed values were statistically significant by using Scypi.
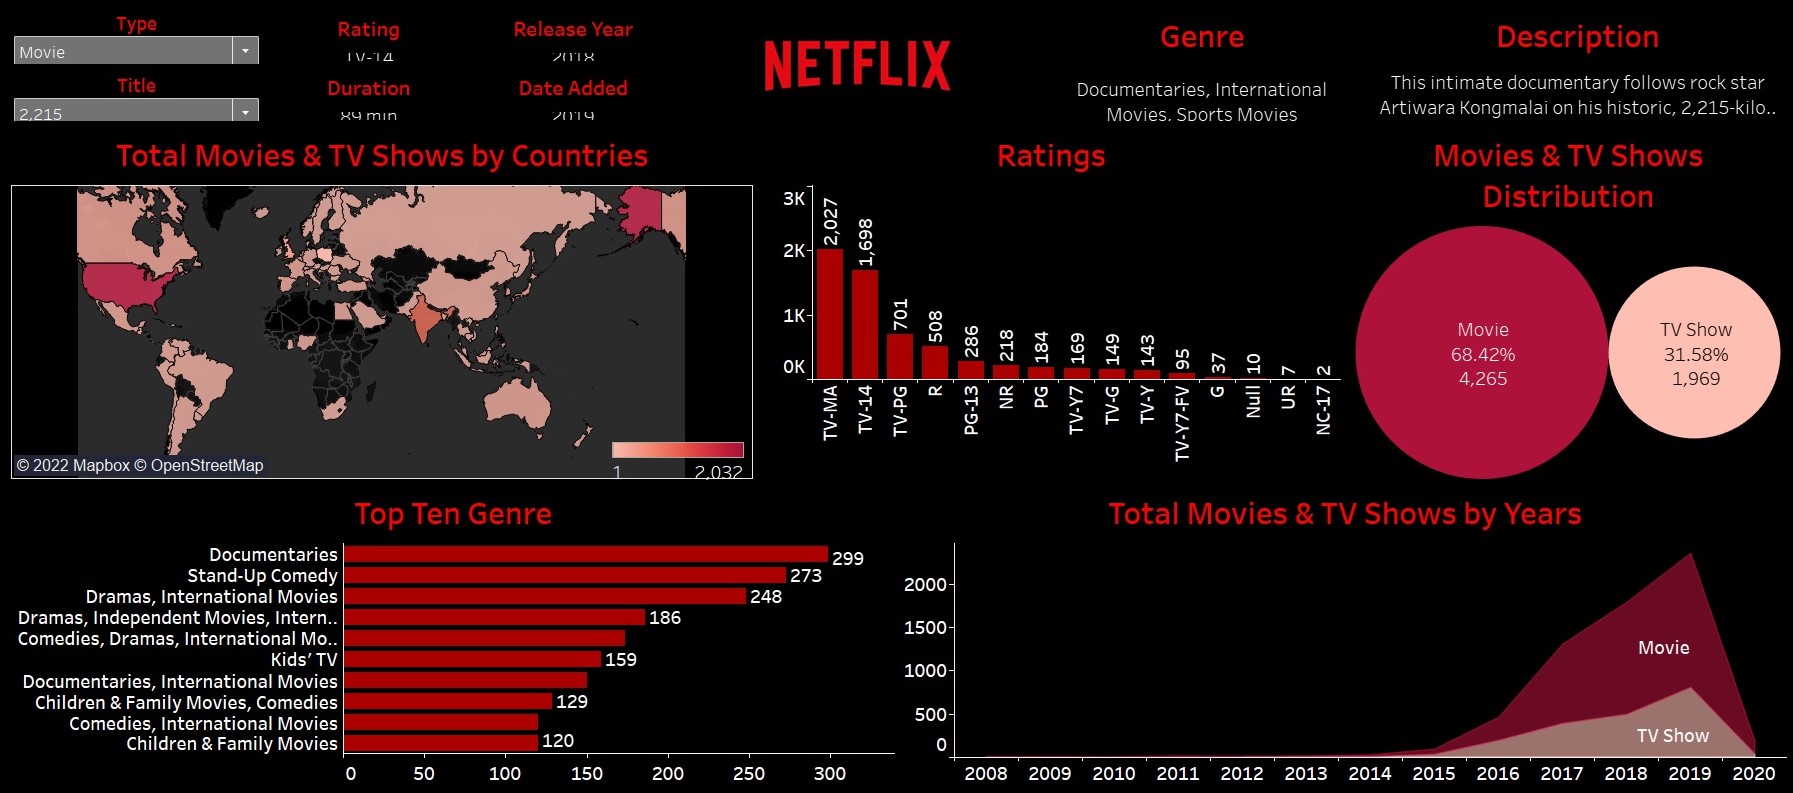

TABLEAU DASHBOARDS

Tableau is an interactive data visualization software. It is a great and versatile tool for visualizing data. My tableau dashboard projects can be found on my Tableau Public profile. Tableau Public is a free platform to explore, create, and publicly share data visualizations online.
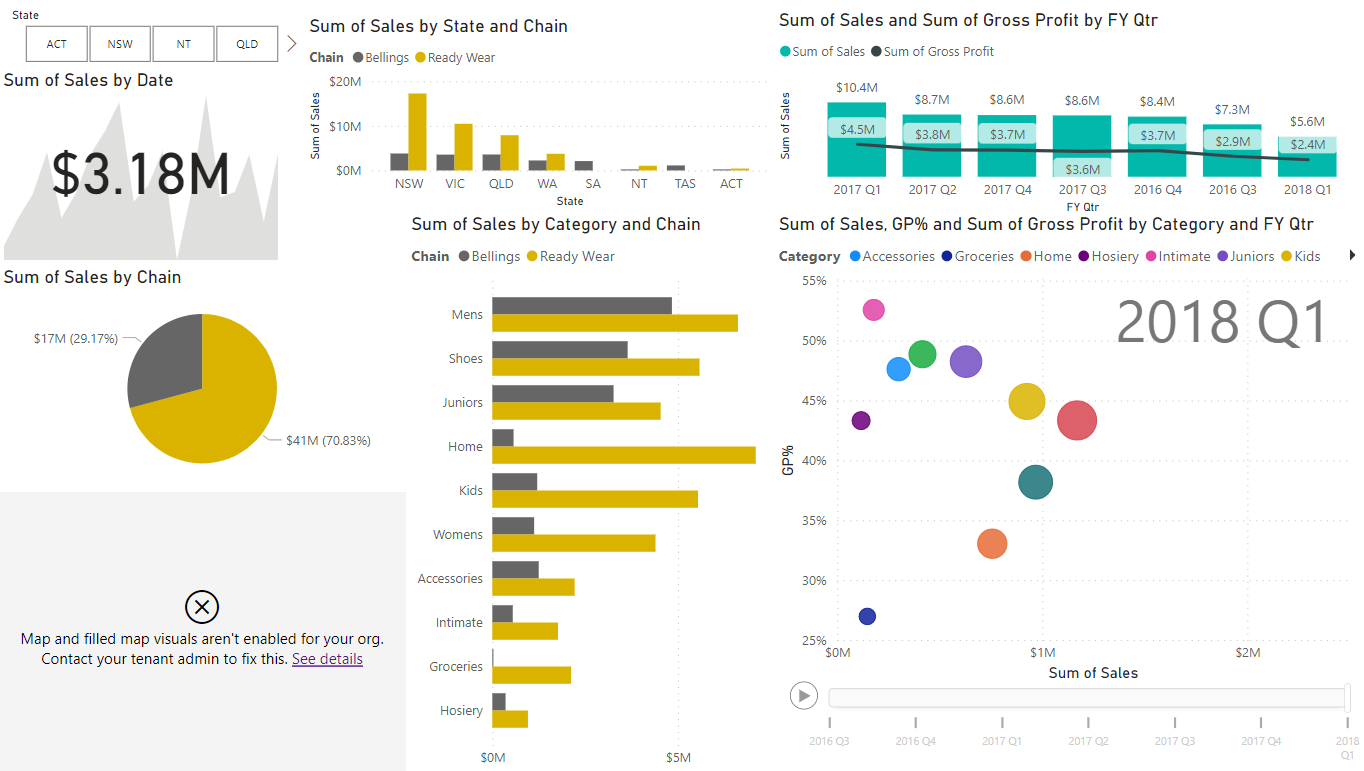
POWERBI DASHBOARDS

In this dashboard project the sales in detail such as regional and time aspects were analyzed and visualized. The first page of the dashboard contains the most important KPI’s. The second page examines the sales in different regions. You can navigate through the dashboard using the menu on the left of each page.

CERTIFICATIONS